 Another box ticked in the 'graphs you can draw with OmniGraffle' list. Work in progress this chap, but then, so are they all! At least I don't call it a beta forever and ever and ever, when it obviously works OKish... (*cough*Flickr*cough*).
Another box ticked in the 'graphs you can draw with OmniGraffle' list. Work in progress this chap, but then, so are they all! At least I don't call it a beta forever and ever and ever, when it obviously works OKish... (*cough*Flickr*cough*).
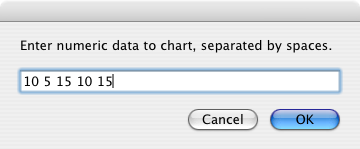 In the window that appears enter the appropriate data, separated by spaces. It doesn't have to be whole numbers.
 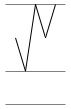 Hit OK... tada!
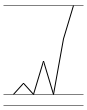
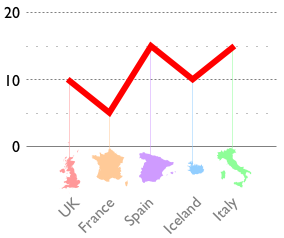
The horizontal lines on the graph are the highest value,
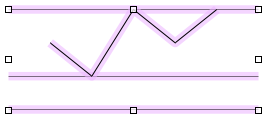 Select it all, and drag the handles to make it bigger - it all stays in proportion. I'd like to say I spent ages scripting this behaviour in by hand, but I can't, because OmniGraffle just works this way.
 Scales can be added much in the same way as they can be with the bar chart script. A full explanation of how to do that nicely is on that page. The lines that are drawn by the script serve as a useful guide for making the ones for the scale. Just duplicate one of them the number of times that you want scale lines, then Distribute space between the lower and higher ones. (Not the best explanation; check out the bar chart page which should hopefully help.)
The vertical lines here are aligned with the start and end points of the graph by hand; these will hopefully be done by the script in the next version, as they're quite handy too.
 The finished product! Yes, this did take some time. If you don't have the time, use Excel. It'll be ugly; it's a compromise. Hopefully later versions of this script should make the process simpler.
(No idea what the Y axis represents here. It could almost be sunshine, if the UK were lower than France.)
Note: The observant amongst you will have noted that using a line chart for the discrete data set here (countries) makes no sense. There is no data for half-way between UK and France, so it doesn't make sense to have a value associated with it. Also, two Frances dost not maketh an Iceland. You'd be right. I just wanted an excuse to use John Oram's excellent map stencils. Looking forward to those being a standard part of the next version of OmniGraffle!
© 2026 — 83957jgtyd@liamekaens.com