 Frustrated by a lack of simple software for drawing easily editable pie-charts from simple data, I wrote a simple Applescript for the excellent OmniGraffle drawing package to do just that.
Pie charts are a bad way of displaying information. Consider using a bar chart instead, which allows easier comparison of values than the angular plotting of variables.
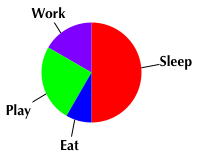
Take the example shown here. It's easy to tell that Sleep is half, and kinda easy to see that Play is probably about a quarter. It's impossible to tell without a protractor how much is Work or Eat, although (in this case) you can see that Eat is less than Work. It's difficult even to tell if Eat is more or less than half of the size of Work. Then again, they do look very... Use with caution, in limited situations.
Latest version: Adds labels on little stalks to the slices! (2006-02-20)
Using
- Download
 pie_chart.zip (8 KB).
- Install the script.
- In OmniGraffle open a new document and select
 > Pie chart.
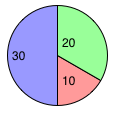
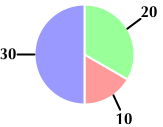
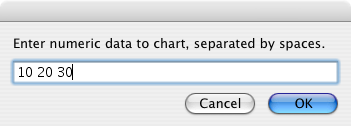 In the window that appears enter the appropriate data, separated by spaces. It doesn't have to be whole numbers, but it will freak out if your put in negatives. Also, it doesn't necessarily have to add up to 100.
 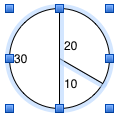 Hit OK... tada! (Version 1.3 of this script produces the labels for slices on lines, so will look a little different from the images here.)
Tips and other uses
What you have now is pretty neat, but can easily be made to look a lot better with some obvious (and some less obvious) tricks.
 Change the fill colour of the pie slices.
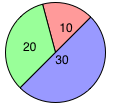 Rotate the chart if you need to. Select all the slices, then either Command-drag one of the blue control boxes or twiddle the twiddly thing in the Geometry inspector palette. The positioning of the numbers tends to get a little confused when you do this. Some form of sanity can be restored by clicking on the text alignment thingy in the Text Position inspector.
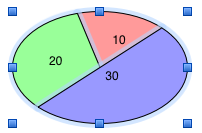 Scale the chart. Again, select all the slices, then drag the blue control points around. Holding down shift while doing this preserves the aspect ratio.
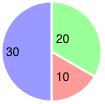 Space out the slices. Slightly sneaky this one. Setting the stroke colour of the slices to the same as the background, then changing the stroke thickness changes the apparent gap between the slices.
 New in v1.3! Labels and lines are automatically added. Obviously the labels are just numbers, so you will probably want to change them to be something more meaningful.
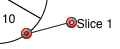 New in v1.1! The script now automatically adds a magnet half way around the arc of each pie slice. This makes lines from labels or other shapes naturally attach themselves in a much more sensible fashion.
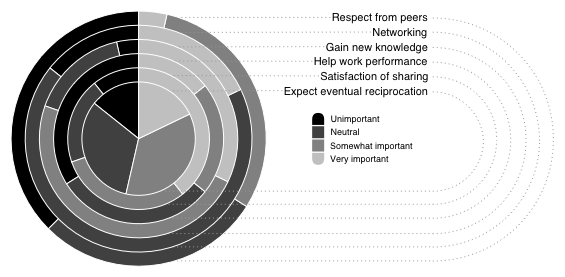
And if you've got a lot of time to kill, and a limited palette...